Put your own protein data on screen: ProtVista 5 is in beta
Research groups in protein science keep annotations of their own: hotspot regions, custom domain calls, lab-specific variant lists. They usually sit in a spreadsheet, away from the sequence context that makes them mean something.
ProtVista 5, now in beta, puts them on screen: alongside UniProt’s domains and variants, or on their own. It is for scientists, bioinformaticians, and developers alike, and needs very little code. Everything below takes a short text file, a button, or a copy of a ready-made page.
ProtVista is free and open source, and anyone can contribute. Version 5 includes work from outside our team. Thank you to Jishanahmed AR Shaikh, who made the code more reliable and easier to maintain, and to Epi-Lo, who took on the same problem.
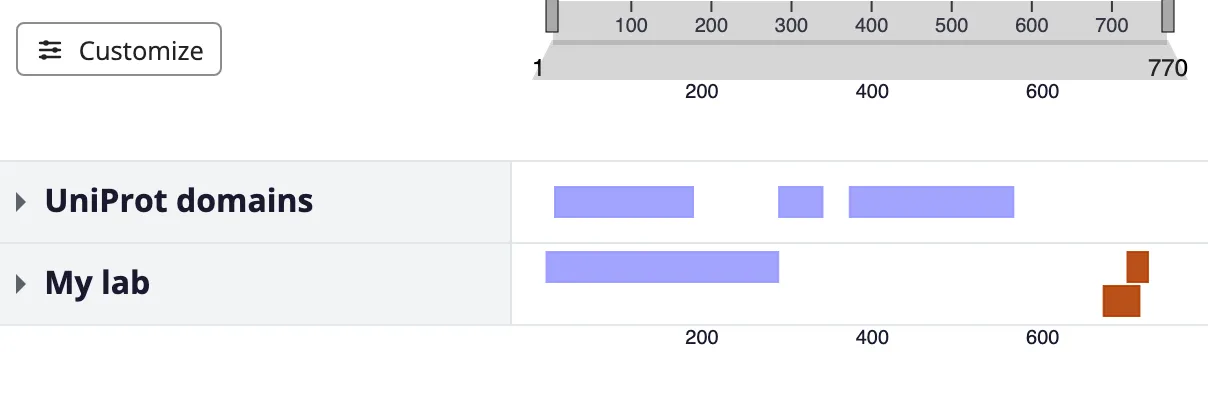
Your own annotations beside UniProt’s, from one configuration file.
Load your own data
Section titled “Load your own data”Save your annotations as CSV, TSV, JSON, or BED, then point to them from a short configuration file. The file extension tells ProtVista how to read your data, so there is nothing else to set up:
accession: P05067rows: - id: hotspots label: Hotspots kind: features data: ./hotspots.csvThat is the whole change, and it gives you a viewer with just your own track on
it. Add an extends: line and the same track sits alongside everything UniProt
already shows. Either way the file works whether you are looking at one protein
or a hundred, and nothing assumes EMBL-EBI as the source, so a group with its own
database can point at that instead.
Learn more: Load your own data covers all four
formats and every field you can use.
Author a config covers extends: and how the two
configurations merge.
Rearrange what you see
Section titled “Rearrange what you see”ProtVista now has a Customize button. Click it and each row gains move-up and move-down buttons and a show/hide switch: reorder groups, reorder tracks within a group, hide what you don’t need. No configuration file, no code, and nothing to drag, so it works the same with a mouse, a touchscreen, or a keyboard.
The arrangement sticks: it is still there next time you open that viewer, and you can share it as a link, so “move Variants above Domains” becomes something you send rather than something you explain.
Learn more: Customize the layout.
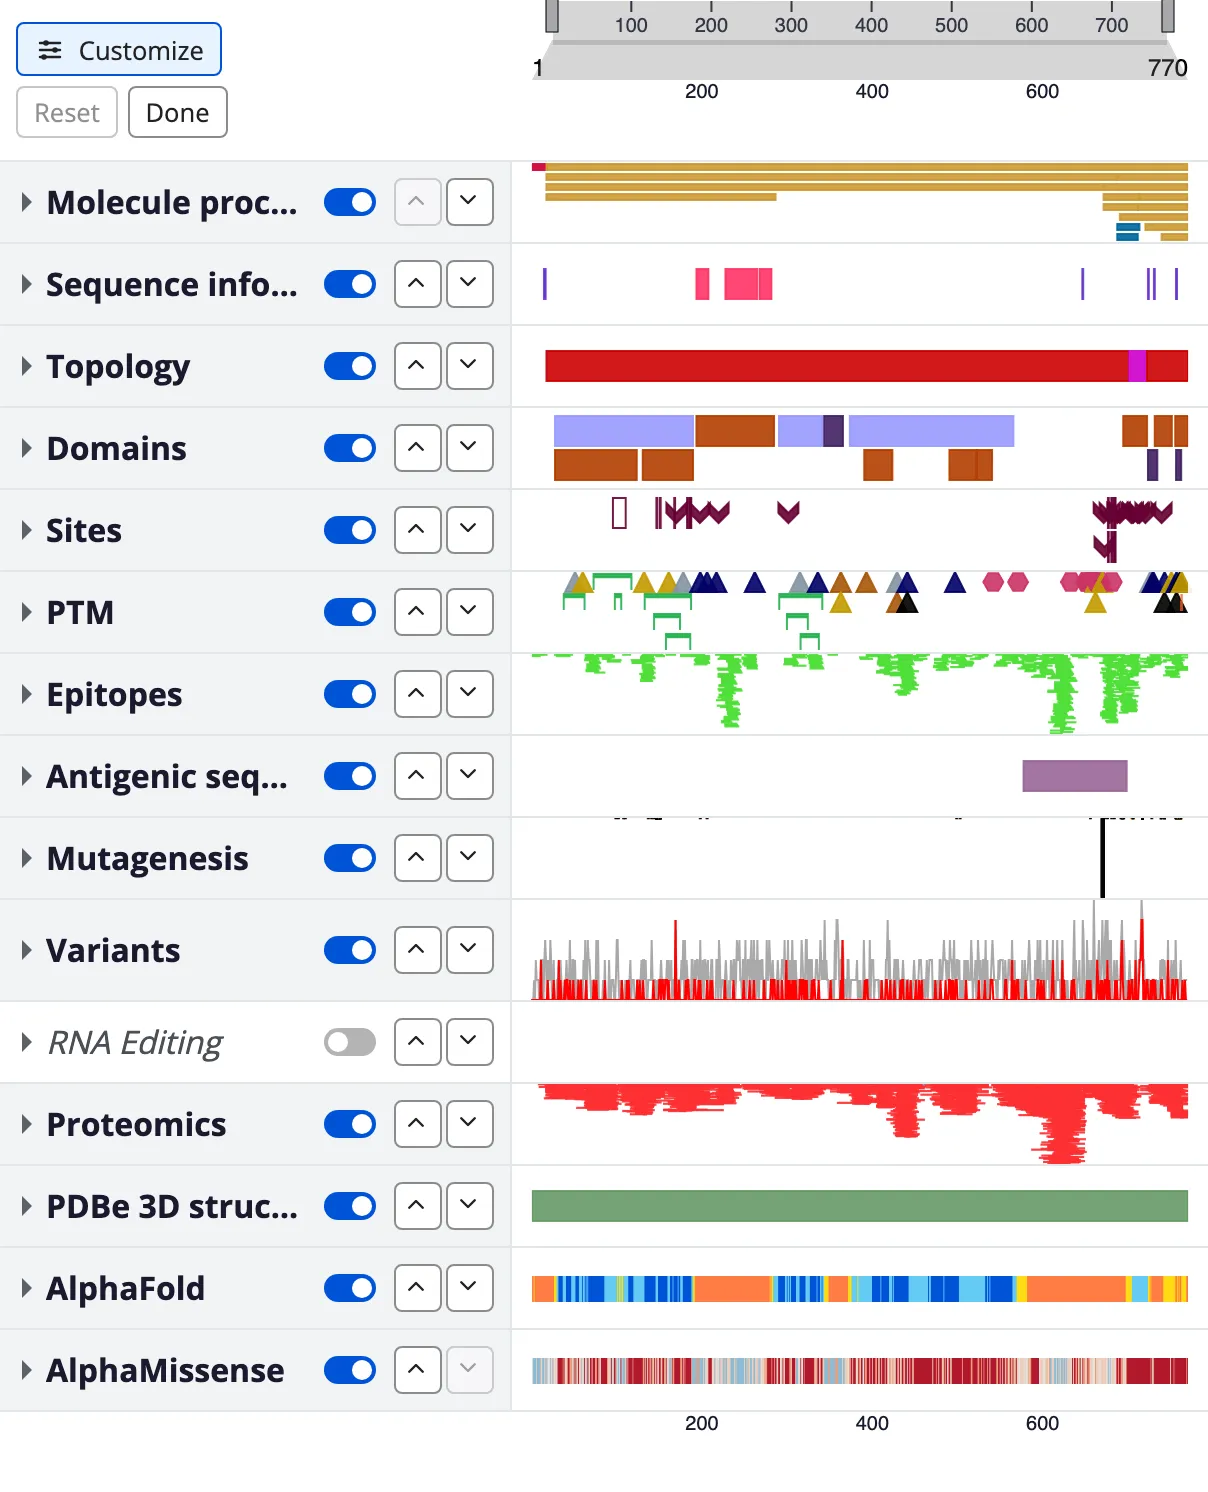
Customize mode: reorder and hide rows without touching a configuration file.
Try it now, then publish it
Section titled “Try it now, then publish it”The playground is an editor beside a live viewer, with nothing to install. Type an accession, edit the configuration, watch the visualisation change. Every view has its own web address, so you can send a colleague exactly what you are looking at.
When you want to keep a view you’ve built, the
Starter Kit is a
page and a configuration already wired together. Select Use this template,
drop your data file into the data folder, edit config.yaml, and switch on
GitHub Pages — that gives you a shareable web page with nothing installed. Each
time you save a change, an automatic check validates config.yaml against
ProtVista’s schema, so a mistyped or unknown field is caught and named for you
rather than slipping through unnoticed.
Getting it
Section titled “Getting it”The playground and the Starter Kit need nothing installed. If you embed
ProtVista in your own site, this release is on npm under the beta tag:
npm install protvista-uniprot@betaIt is a beta on purpose. The stable 4.9 release stays the default, so nothing you already have will change, and the configuration format may still shift before 5.0 is final. If you are building on it now, we would particularly like to hear from you.
Hackathon: visualise your own data
Section titled “Hackathon: visualise your own data”Bring us an idea: a dataset you want to see on screen, a figure you need for a paper, a way to show your group’s data next to UniProt’s. Everyone is welcome, whether or not you have used ProtVista before, and you do not need to have contributed to the project.
| Dates | 7–9 October 2026 |
| Format | Online, free |
| Places | 30, first come first served |
| Applications close | 1 October 2026 |
Where to go next
Section titled “Where to go next”- Tutorial — from an empty page to your own viewer, in four steps.
- Load your own data — CSV, TSV, JSON, and BED, field by field.
- Customize the layout — reorder, hide, and share the result.
- Author a config — what goes in the configuration file.
- Match your site’s style — set the colours to match your own pages.
- Playground — try changes live and share them by link.
- Starter Kit — use the template, add your data, publish.
- Source and issues — questions, bugs, and feature requests.
- Office hours — monthly live help with setup and your own data, no registration needed.
A prerecorded webinar covering the same ground in more depth is available.
30 July 2026.
This work was supported by the Research Software Maintenance Fund, managed by the Software Sustainability Institute and funded by UKRI grant reference AH/Z000114/1.
Code is licensed under the MIT License; documentation and sample data are licensed under CC BY 4.0.